Say an app could get your crew better organized for one more dollar per person per month. Is that a good deal? It depends on a number few owners ever work out: how many minutes that dollar has to save.
The short answer: at the median wage for a restaurant cook, $1 is 3 minutes and 20 seconds of paid time a month. That sounds like an easy win, but it is the wrong bar, because the fee is the smallest cost of using any tool. Count the time people spend using it and the real bar is about one minute saved per shift, per person. Below is the working, a two-week test you can run with a pencil, and the cases where a dollar a person stops being true.
We make tick-tock-done, and the prices in the first table are ours. Read that part knowing it. The arithmetic works for any tool: put its price in instead.
What $1 a person means at each crew size
Most task apps charge per person. Ours charges the team: $5 a month for up to 10 people and $1 a month for each 2 more, and one person is free. So the cost per person falls as the crew grows, and $1 is exact at five people.
| Crew size | Monthly bill | Per person |
|---|---|---|
| 1 | $0 | $0 |
| 2 | $5 | $2.50 |
| 3 | $5 | $1.67 |
| 5 | $5 | $1.00 |
| 8 | $5 | $0.63 |
| 10 | $5 | $0.50 |
| 12 | $6 | $0.50 |
| 15 | $8 | $0.53 |
| 20 | $10 | $0.50 |
| 25 | $13 | $0.52 |
| 30 | $15 | $0.50 |
So "$1 a person" is a fair ceiling from five people up, and it is too low for a crew of two, three or four. Those crews pay the same $5, which works out at more per head.
What a dollar buys in paid time
These are US median wages from the Bureau of Labor Statistics, May 2025. The full-time month is 2,080 hours divided by 12, or 173.3 hours.
| Job | Median hourly wage | Time $1 pays for | Full-time monthly wage | $1 as a share of it |
|---|---|---|---|---|
| Restaurant cook | $17.98 | 3 min 20 s | $3,116 | 0.032% |
| Janitor or building cleaner | $17.71 | 3 min 23 s | $3,070 | 0.033% |
| Construction laborer or helper | $22.44 | 2 min 40 s | $3,890 | 0.026% |
That is wages alone. Payroll tax and other employer costs make each paid minute dearer, so the true time is a little shorter. Put your own wage in: 60 divided by the hourly wage is the number of minutes $1 pays for.
The fee is about three minutes a month. Using the tool can easily cost several times that.
The fee is the small cost
Here is the part price comparisons leave out. Every tick is paid time. Take one cook who ticks 10 items a shift at 5 seconds each, for 22 shifts a month, in a crew of five whose lead spends two hours setting the app up. Spread that setup over a year. These are our example figures, not measurements, so swap in your own.
| Cost per person, per month | Working | Minutes | At $17.98 an hour |
|---|---|---|---|
| The fee, crew of five | $5 / 5 people | 3:20 | $1.00 |
| Ticking off work | 10 ticks x 5 s x 22 shifts | 18:20 | $5.49 |
| Setup, spread over a year | 120 min / 12 months / 5 people | 2:00 | $0.60 |
| Total | 23:40 | $7.09 |
So the bar is about 24 minutes per person per month, not three. Over 22 shifts that is a little more than one minute a shift. An app that saves less than that loses money, even at a dollar. It also means a shorter checklist can matter more than a cheaper app: cutting 10 ticks to 5 saves more than the whole fee.
Where that minute could come from
The best-known numbers on this come from construction. In April 2018 FMI and PlanGrid, a construction software company, surveyed 599 construction leaders about project team members' time.
| Reported time, per team member, per week | Hours |
|---|---|
| Looking for project data, such as revised drawings and cut sheets | About 5.5 |
| Resolving conflict between parties on the job | Nearly 5 |
| Dealing with mistakes and rework | About 4 |
| Total | Over 14 |
Treat these with care. They are estimates from leaders rather than stopwatch readings, the sponsor sold software aimed at this problem, the data is from 2018, and project team members are not the same as a laborer on the slab. But look at the size of the gap. Over a five-shift week, 5.5 hours of searching is 66 minutes a shift, and one minute a shift is under 2% of that. If the survey overstates the problem tenfold, the bar is still only about 16% of what is left.
We could not find the same figures for a five-person kitchen or a cleaning crew. That is why it is worth measuring your own.
Test it in two weeks with a pencil
Week one, change nothing. Keep a tally sheet where the crew can reach it. Mark three things: each "where is it, who has it, did anyone do it" question, each job redone, and each extra trip. Note the rough minutes.
Work out the month. Add up the minutes for the week, multiply by 4.33, and multiply by the wage per minute.
Week two, one list. Put every job with a person's name on one shared list, in any tool, or on a whiteboard if you prefer. Set one rule: if it isn't on the list, nobody has been asked to do it. A task board for a five-person team has the setup, and the checklist builder makes a first list.
Tally again, then compare. Same sheet, same marks. Keep the tool if the drop beats your bar. Drop it if it doesn't.
Here is how the sums look for a kitchen of five. The tally is made up, to show the method.
| Week one tally | Count | Minutes each | Minutes a week |
|---|---|---|---|
| Where is it, who has it, did anyone do it | 40 | 1.5 | 60 |
| Jobs redone | 2 | 20 | 40 |
| Extra supply trips | 1 | 25 | 25 |
| Total | 125 |
That is 125 x 4.33, or 541 minutes a month, worth about $162 at $17.98 an hour. The bar for five people is 5 x 24, or 120 minutes. So the tool has to remove about 22% of the tally to pay for itself in this kitchen. If week two shows a smaller drop, it isn't paying.
Why having the tool isn't the same as being organized
The clearest evidence comes from a very different workplace, so read it as an analogy. In 2009 a study of eight hospitals in eight cities reported that deaths after surgery fell from 1.5% to 0.8% and complications from 11.0% to 7.0% after a 19-item checklist came in. It compared before with after, with no separate control group, and the checklist came with a program to implement it. Then in 2014 a study of 101 Ontario hospitals, about 109,000 operations before a checklist and 106,000 after, found no significant change: deaths 0.71% to 0.65%, complications 3.86% to 3.82%. It looked at three months either side of adoption, so it may have caught the checklists early. An editorial published with it argued that the likely reason was that the checklist wasn't really being used.
Same kind of tool, very different results. A list on the system changes nothing by itself. If only the owner opens the app, you have paid a dollar a person for one person's notebook. That is what the second week of the test is for.
Where $1 a person doesn't hold
Crews under five. As the first table shows, the bill is $5 for two people too. That's $2.50 each.
Lots of photos and video. The Team plan has 1 GB for pictures and video, and each further 1 GB is $10 a month. Our app keeps photos at 2,000 pixels; at about 1 MB each (our working assumption, not a measurement), a crew of 12 posting one photo each per shift, 26 days a month, adds about 312 photos, roughly 300 MB, a month, and reaches 1 GB in a little over three months. One more GB takes a $6 bill to $16, or $1.33 a person. A single video can be up to 100 MB, so a video-heavy crew gets there much faster.
One site, one shift, everyone in the room. A list on the wall costs nothing and needs no sign-in. If your week-one tally is short, a tool won't pay at any price.
Doing this in tick-tock-done
In tick-tock-done every job on a crew's list shows who has it and when it's due, and how many comments and pictures it has. The same app has the week's shifts and a time clock, so the two-week test can run on one list. For what that adds up to against separate apps, see what a crew app replaces, priced against four separate tools.
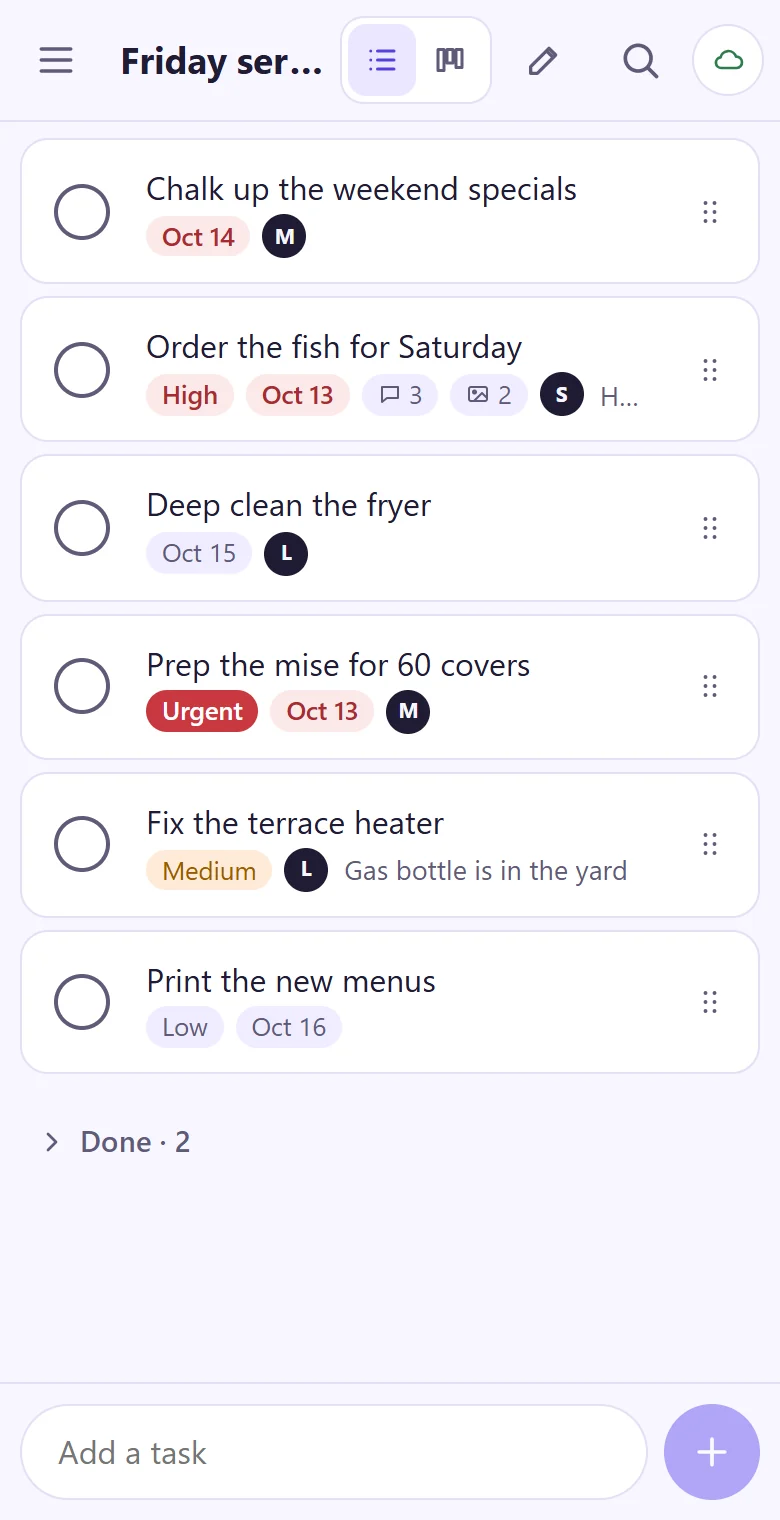
One list for your crew, with shifts, a time clock and photos on the jobs.
See how it worksWhat this does not show
No study here measures a small crew using an app. The wage and price sums are arithmetic. The tick times and the tally are our own examples.
The construction survey is vendor-sponsored and from 2018, and it reports what leaders estimated, not timed work.
The surgical studies are about operating rooms. They suggest results depend on real use. They don't show what a list does in a kitchen, and neither was a randomized trial.
Saved minutes aren't always saved money. If a crew is paid for the shift anyway, a saved minute only pays off if it goes to other work.
We make tick-tock-done, so we are not neutral. Prices are as of 1 November 2026; check the pricing page before you decide.
Sources
US Bureau of Labor Statistics, Occupational Outlook Handbook, median pay May 2025. Cooks, Construction laborers and helpers, Janitors and building cleaners
PlanGrid and FMI, "Construction Disconnected" survey, press release, 2018. Release
Haynes AB et al., "A surgical safety checklist to reduce morbidity and mortality in a global population", N Engl J Med 2009;360:491-9. PubMed
Urbach DR et al., "Introduction of surgical safety checklists in Ontario, Canada", N Engl J Med 2014;370:1029-38. PubMed
Report of the Ontario study and its editorial. MDedge
tick-tock-done pricing, read 1 November 2026. Pricing