In the 1930s the psychologist Clark Hull put rats in a straight alley with food at the end and timed them. They ran faster the closer they got to the food. He called it the goal gradient: effort rises as the goal gets near. Anyone who has watched a crew speed up on the last three items of a closing list, or found themselves typing faster on the last paragraph of a report, has seen the human version.
For decades the idea sat in animal psychology. Then, in 2006, two papers tested it on people with loyalty cards, and the results are still the main evidence. This piece covers what those studies found, where later work showed the effect is not a simple upward line, and what it suggests for anyone who writes checklists for themselves or a team.
The coffee card study
Ran Kivetz, Oleg Urminsky and Yuhuang Zheng ran their test in a university café with a "buy ten coffees, get one free" card. They recorded the dates on 949 completed cards.
People sped up as the card filled. The gap between coffees shrank by about 20% from the first stamp to the last, about 0.7 days on average. Customers were not drinking more coffee because they liked it more by stamp nine; they were closer to the free one.
A fake head start worked too. In a field experiment, some customers got a normal 10-stamp card and others a 12-stamp card that came with 2 "bonus" stamps already on it. Both needed exactly 10 more coffees. The bonus-card group finished in 12.7 days on average, against 15.6 days for the plain card: nearly three days, or about 20%, faster.
Then it reset. After a free coffee, customers who started a second card slowed down again: the first two gaps on the new card (3.1 and 2.7 days) were longer than the last two on the old one (2.2 and 2.1 days), and about the same as the start of the first card.
Not just coffee. On a music site that paid people in reward certificates for rating songs, members visited more often, rated more songs per visit and were less likely to give up as they got near a reward.
The car wash study
The same year, Joseph Nunes and Xavier Drèze gave 300 car wash customers one of two loyalty cards. One needed 8 stamps for a free wash and started empty. The other needed 10 stamps but came with 2 already stamped. Both meant 8 more paid washes. In the months that followed, about 34% of customers with the head-start card earned the free wash, against about 19% with the empty card, and they got there faster.
The authors called it the endowed progress effect: progress you are given still counts as progress in your head. They also found it depends on how the head start is framed; it works best when there is a reason for it and when progress is counted in the same units as the goal.
The same eight car washes, framed as 2 of 10 already done, got finished almost twice as often.
Where the simple story breaks
The tidy version, "people speed up near the end, so show them the end", needs three corrections from later research.
There is a middle slump. Andrea Bonezzi, Miguel Brendl and Matteo De Angelis (2011) showed that motivation can be high at the start and near the end and dip in the middle. Early on, each step feels like a big share of the distance from where you started; near the end, each step feels like a big share of what is left. In the middle, neither feels big. Whether people slump depends on which way they are looking.
What to look at changes along the way. Minjung Koo and Ayelet Fishbach (2012) called this the small-area hypothesis: people are more motivated by whichever number is smaller. At the start, "3 done" beats "37 to go"; near the end, "2 left" beats "38 done". A loyalty card that showed the wrong number at the wrong stage did worse.
Finishing resets the clock. The coffee study's slowdown on the second card is the same effect seen from the other side: the moment the goal is reached, the pull is gone, and the next list starts slowly.
On replication: we could not find a large preregistered replication of either 2006 study, successful or failed. The pattern itself is old and has turned up in rats, coffee and song ratings, but the exact effect sizes above come from single studies in one café and one car wash, and many single-study effects in psychology have shrunk when retested. Treat the direction as reasonably solid and the percentages as one good measurement.
What it suggests for checklists
A checklist is a loyalty card for work: a fixed number of steps and a visible count of how many are done. If the effect holds for lists as it did for cards, a few design choices follow.
Make progress visible
A list where ticked items disappear without a trace hides the gradient. Show a count, or keep the done items in view: "7 of 12" is a card with seven stamps on it.
Give a real head start
The car wash trick works without the trick. If an opening list starts with things people always do on arrival anyway (unlock, lights on, ovens on), they tick three items in the first two minutes and start the real work already a quarter of the way through. The progress is real; it is only the framing that changes. Fake items ("arrive at work") are the version that gets eye-rolls.
Short sections instead of one long list
A 40-item closing list has one end, far away, and a long middle. Four sections of 10 (kitchen, bar, floor, lock-up) give four ends to speed up towards and four short middles. Our piece on restaurant opening and closing checklists has examples, and the checklist builder lays a list out by section.
Count up early, count down late
Following Koo and Fishbach: at the start of a long job, talk about what is done; once past halfway, talk about what is left. "Three rooms done" at 10 a.m., "two rooms to go" at 3 p.m.
Guard the last items
If people speed up at the end, the last items get the least care. That is our inference, not something these studies measured, but it is worth acting on: a closing list that ends with "gas off, back door locked, alarm set" is putting its most important checks where attention is shortest. Move them earlier, or ask for a photo as proof (see photo proof on tasks).
Expect the slow start after a big finish
After a long list is done, the next one starts with no pull. Put a quick, easy item first on the next list, or start it the same day while the momentum lasts.
In tick-tock-done
Lists in tick-tock-done keep the ticked tasks under a "Done" count at the bottom, so the stamps stay on the card, and each list in the menu shows how many tasks are still open. Sections can be separate lists (Opening, Closing, Bar) so each has its own end. Our piece on dopamine and the tick covers what the tick itself does, and what it doesn't.
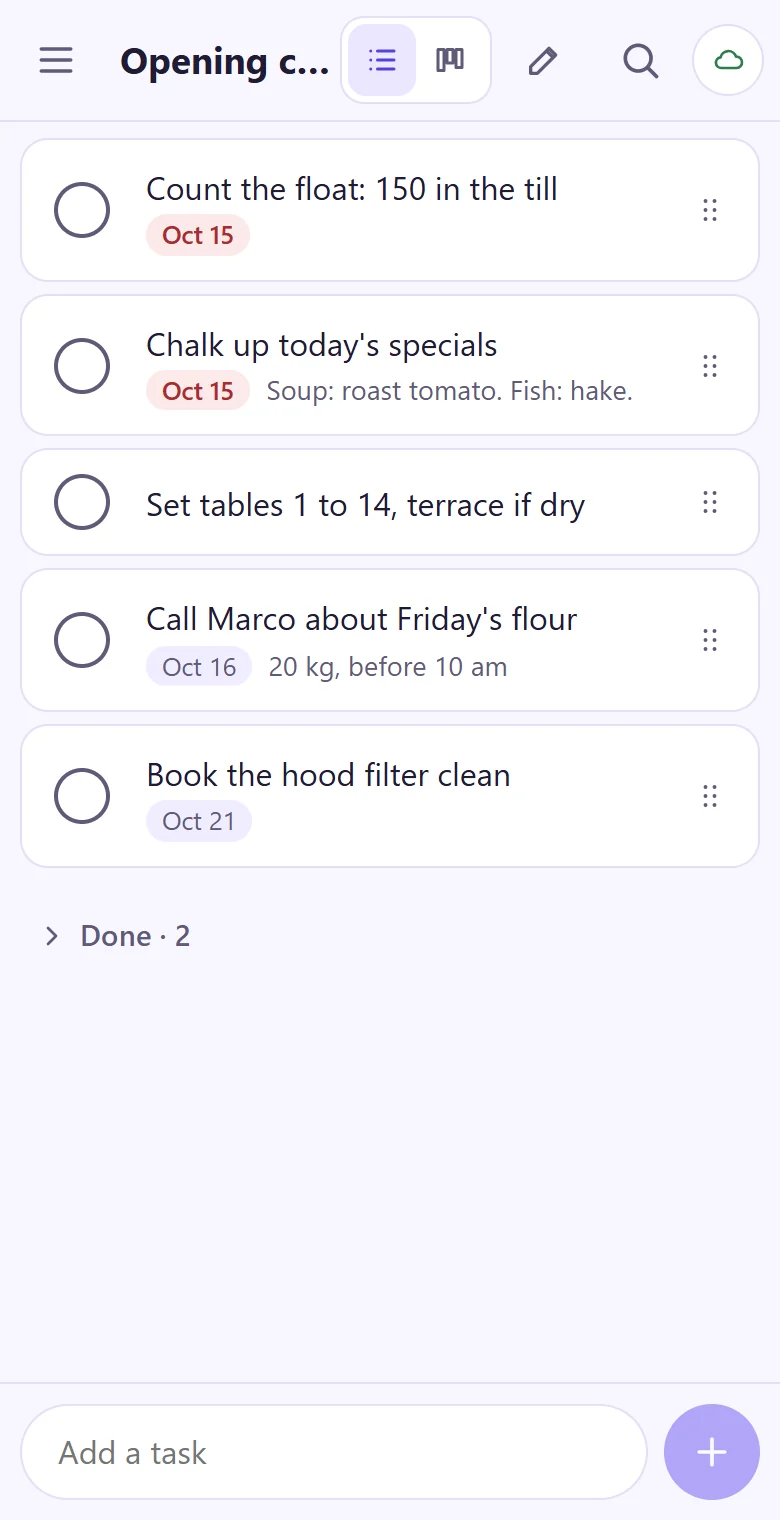
Split the long list into short ones, and let the crew see each one fill up.
Build a checklistWhat the research does not show
The human evidence is mostly about buying, coffee and car washes, plus one song-rating site. We found no study of goal gradients on work checklists; applying it there is our reasoning.
Faster is not better. The studies measured how quickly people reached the goal, not how carefully they did the last steps.
The numbers come from single studies. 20% faster and 34% against 19% are each one measurement in one place. We found no large replication of either study.
The shape varies. The middle slump and the small-area findings show the gradient depends on what people pay attention to; it is not a fixed law of motivation.
People differ. Some find a long visible list daunting rather than motivating, whatever the count says.
Sources
Kivetz R., Urminsky O., Zheng Y., "The goal-gradient hypothesis resurrected: purchase acceleration, illusionary goal progress, and customer retention", Journal of Marketing Research 43(1):39-58 (2006). PDF (Columbia Business School)
Nunes J.C., Drèze X., "The endowed progress effect: how artificial advancement increases effort", Journal of Consumer Research 32(4):504-512 (2006). Article
Knowledge at Wharton, "The lowdown on customer loyalty programs" (on the car wash study). Article
Bonezzi A., Brendl C.M., De Angelis M., "Stuck in the middle: the psychophysics of goal pursuit", Psychological Science 22(5):607-612 (2011). Article
Koo M., Fishbach A., "The small-area hypothesis: effects of progress monitoring on goal adherence", Journal of Consumer Research 39(3):493-509 (2012). Article
Hull C.L., "The goal-gradient hypothesis and maze learning", Psychological Review 39(1):25-43 (1932).